
Quantifying the Tourism and Economic Impact of an Expanding Cruise Season
Client: Western Cape Government | Sector: Tourism & Maritime | Location: Western Cape, South Africa
WC GDP-R contribution
Provincial jobs supported
Passengers this season
Net foreign exchange inflow
Growth in total expenditure (YoY)
The Western Cape Government required an independent assessment of the economic value generated by the 2024/25 cruise liner season. With vessel arrivals and passenger numbers up 18% and 16% respectively, there was an urgent need to quantify the industry’s contribution to GDP, employment, household income and foreign exchange. Credible evidence was needed to support investment decisions, port infrastructure planning and tourism policy, while also accounting for displacement effects at provincial and national levels.
Wesgro is the official tourism, trade and investment promotion agency for Cape Town and the Western Cape, South Africa’s most visited province. It commissioned this study to inform evidence-based policy and investment in the cruise tourism sector.
● R4.34bn cumulative contribution to Western Cape GDP-R across three seasons
● R3.04bn cumulative net foreign exchange generated for South Africa
● 32 000 cruise passengers visited smaller municipalities including Mossel Bay, Hermanus and Saldanha Bay
● R47.5m injected into smaller municipal economies from cruise visitor spending
StratEcon’s analysis gave the Western Cape Government a comprehensive, defensible evidence base to advocate for continued investment in cruise tourism infrastructure and policy. The report demonstrates a consistently strengthening industry, with the 2024/25 season delivering the largest real economic contribution of the three seasons assessed. The cumulative R5.32bn national GDP contribution underscores the industry’s strategic value, while benchmarking against Tourism SA comparators positions the cruise sector as a meaningful and growing component of the province’s visitor economy.
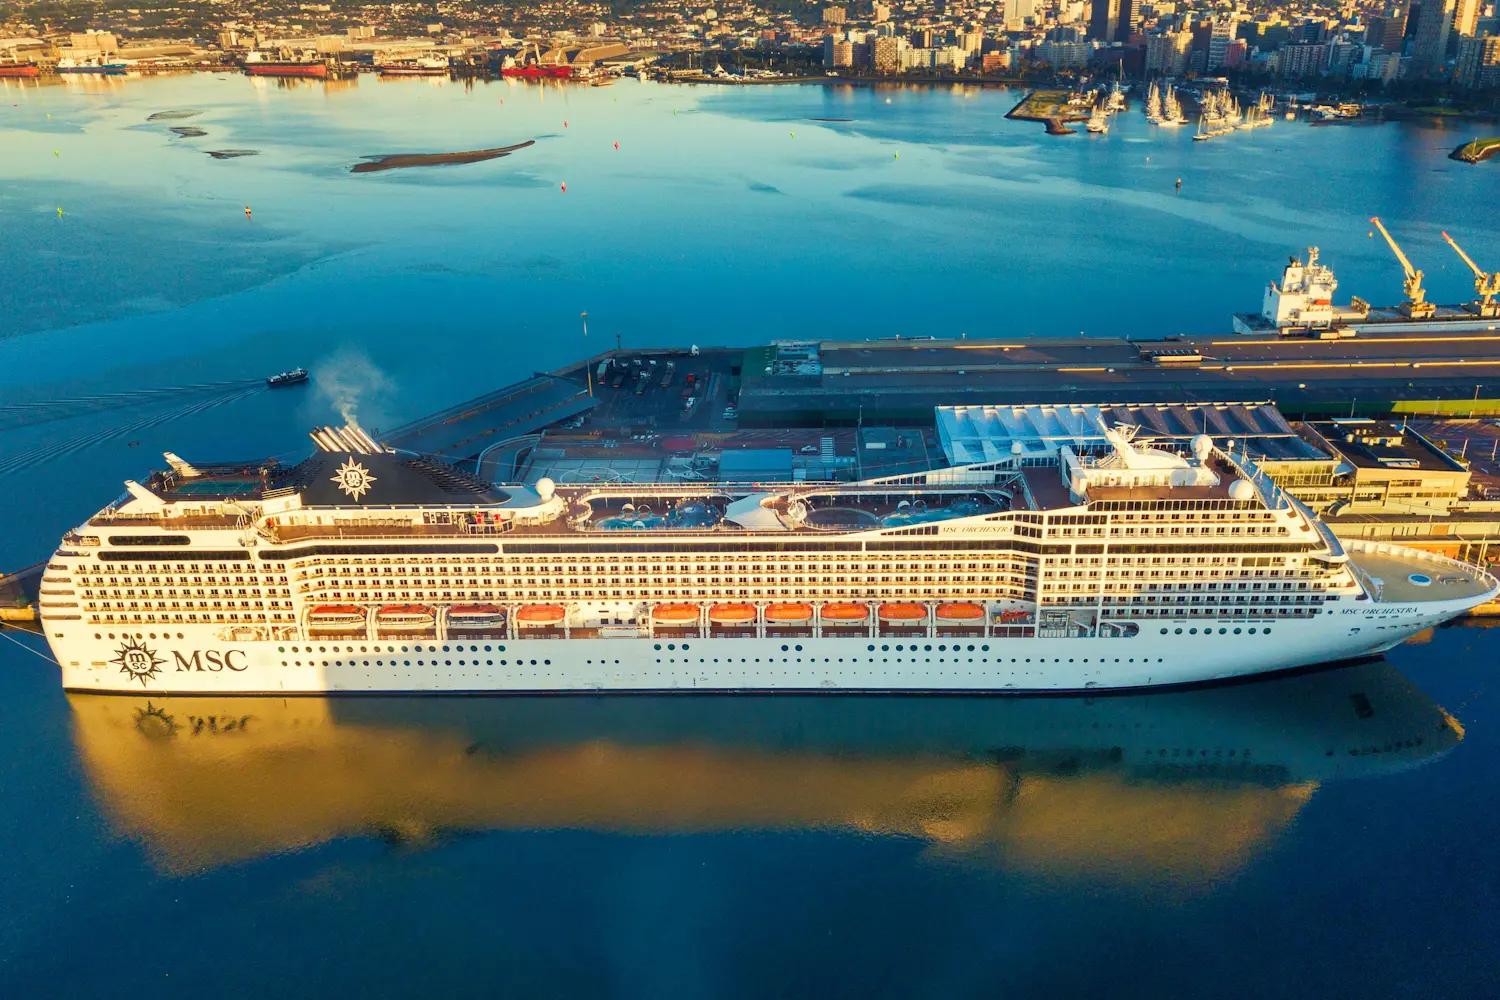
The global cruise industry has rebounded strongly post-pandemic. Cape Town and the Western Cape are positioned as a premier African cruise destination, attracting world cruise vessels, international coastal voyages and expedition ships. The 2024/25 season recorded 79 vessel visits, 18% more than the prior year, with international passengers growing at 39%, well above the 9% global industry growth rate.
Download the report of the Economic Contribution of the 2024/25 Western Cape Cruise Liner Industry.
We use cookies to improve your experience on our site. By using our site, you consent to cookies.
Manage your cookie preferences below:
Essential cookies enable basic functions and are necessary for the proper function of the website.